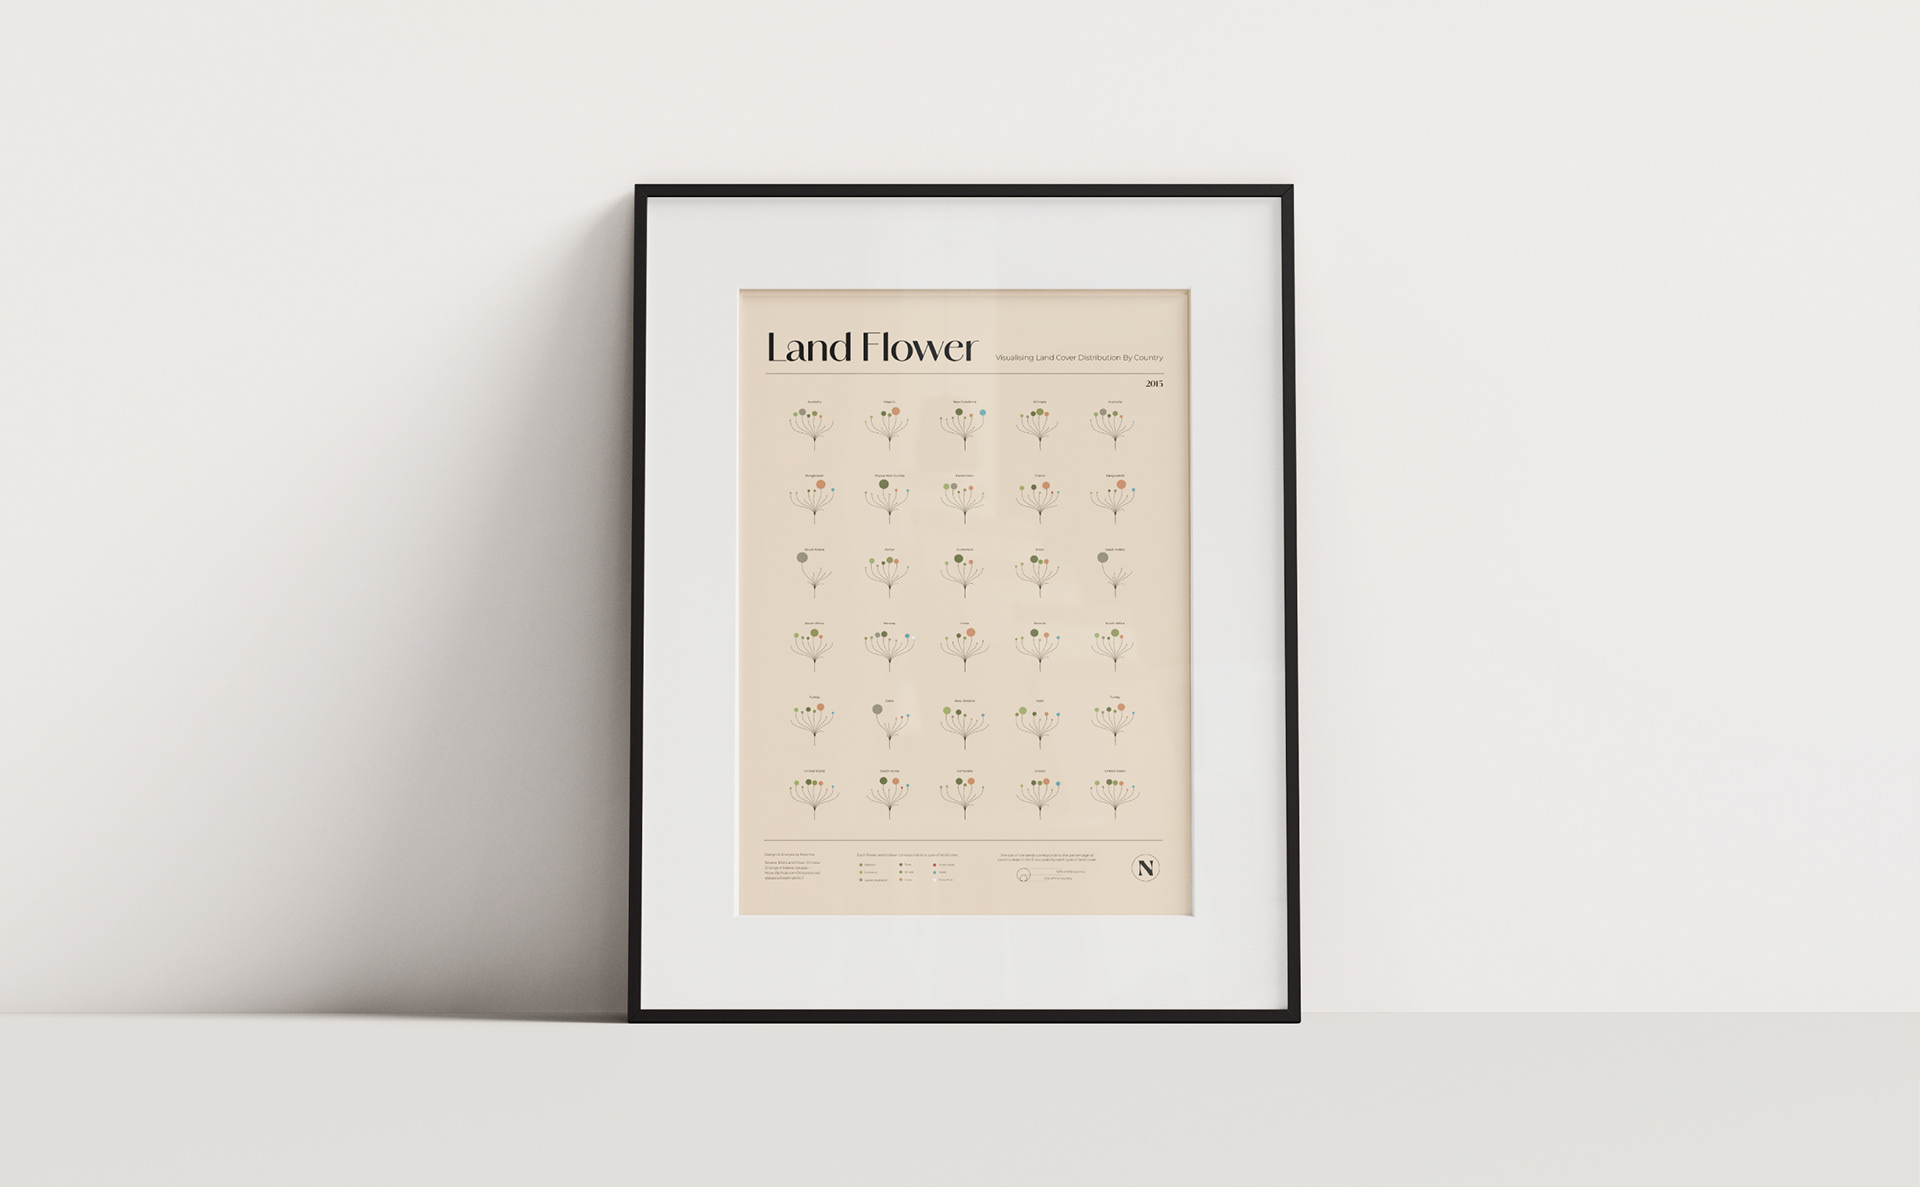
The Land Flower
For ESA Little Picture Competition
Created with Plotly Python & Adobe Illustrator
Data Source: ESA Land Cover Climate Change Initiative dataset (on GitHub)
For the European Space Agency Little Picture competition, I had to create a small data visualisation using ESA satellite data. There was of course a myriad of datasets available but I was very focused on land covers from the start. It's a fascinating dataset but, coming from a design background, it can be hard to make sense of it. It turns out, this difficulty became my main driver in creating a Little Picture!
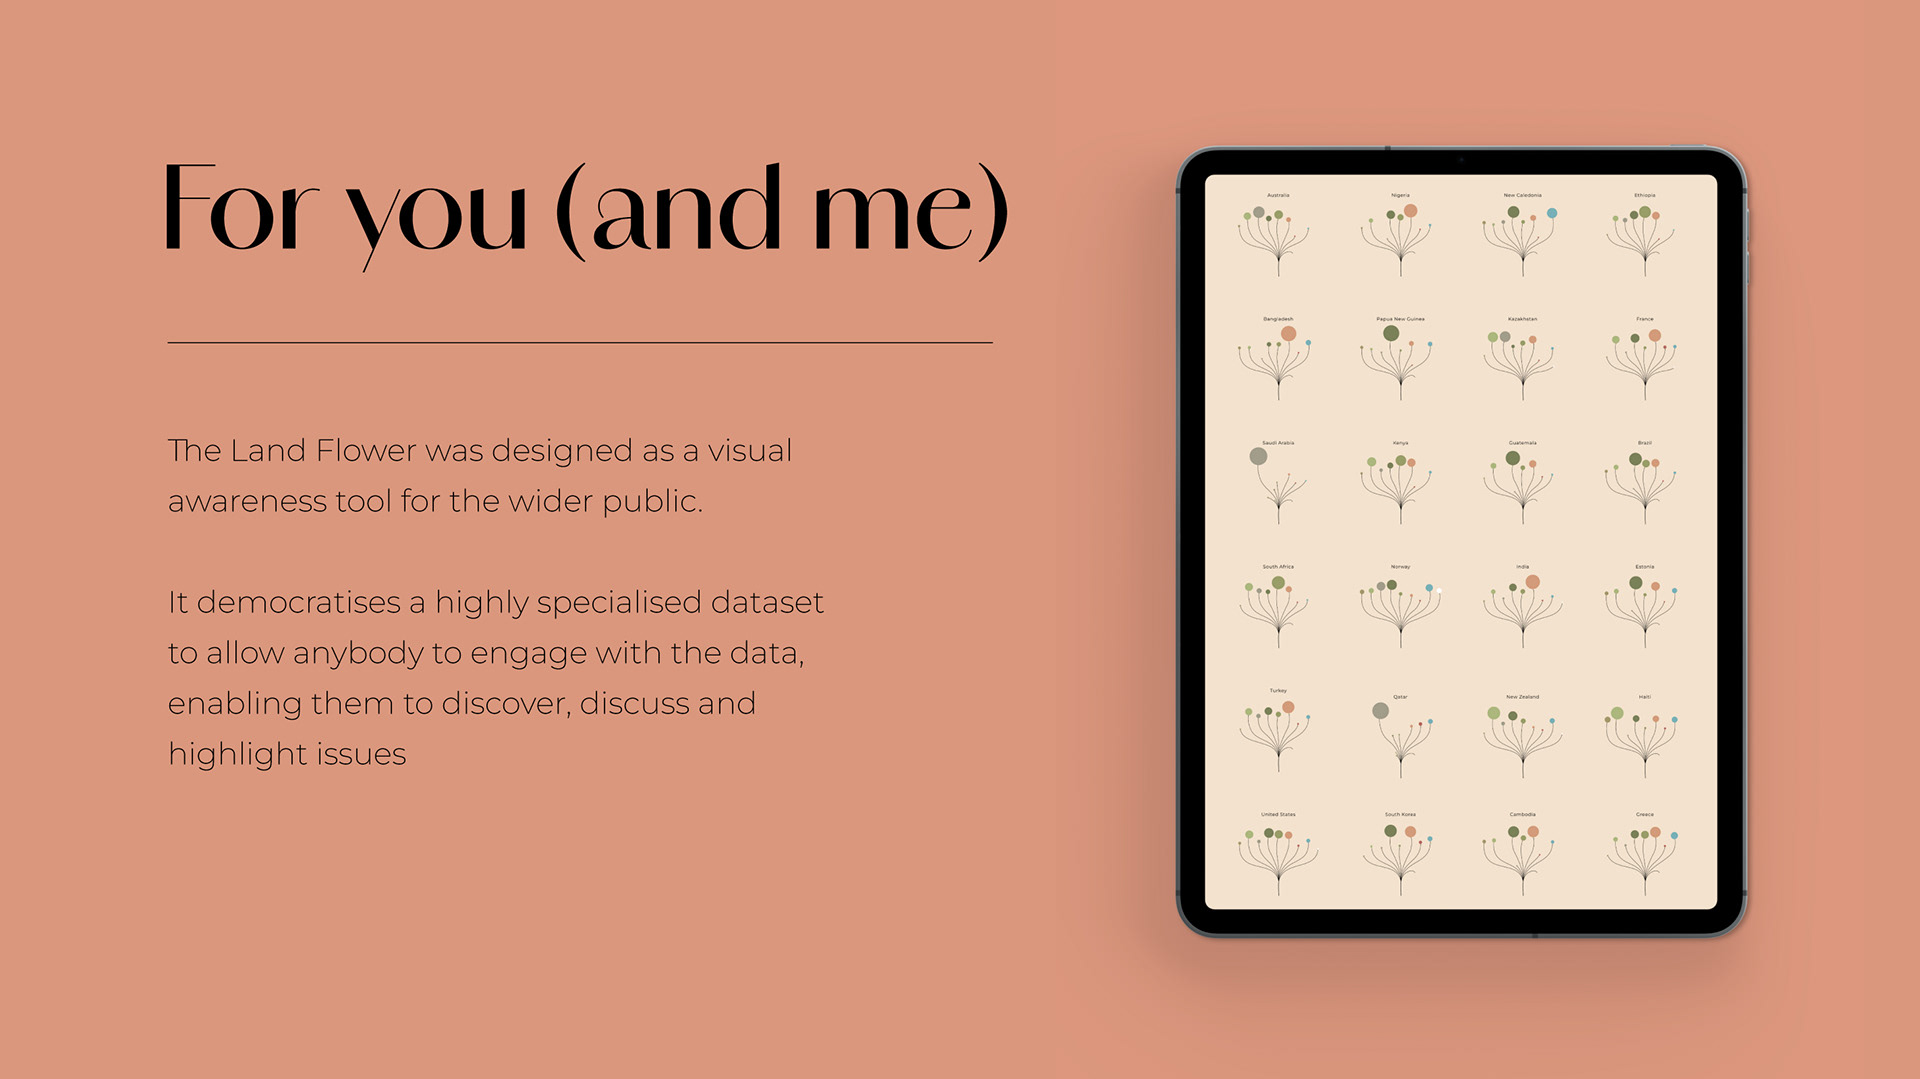
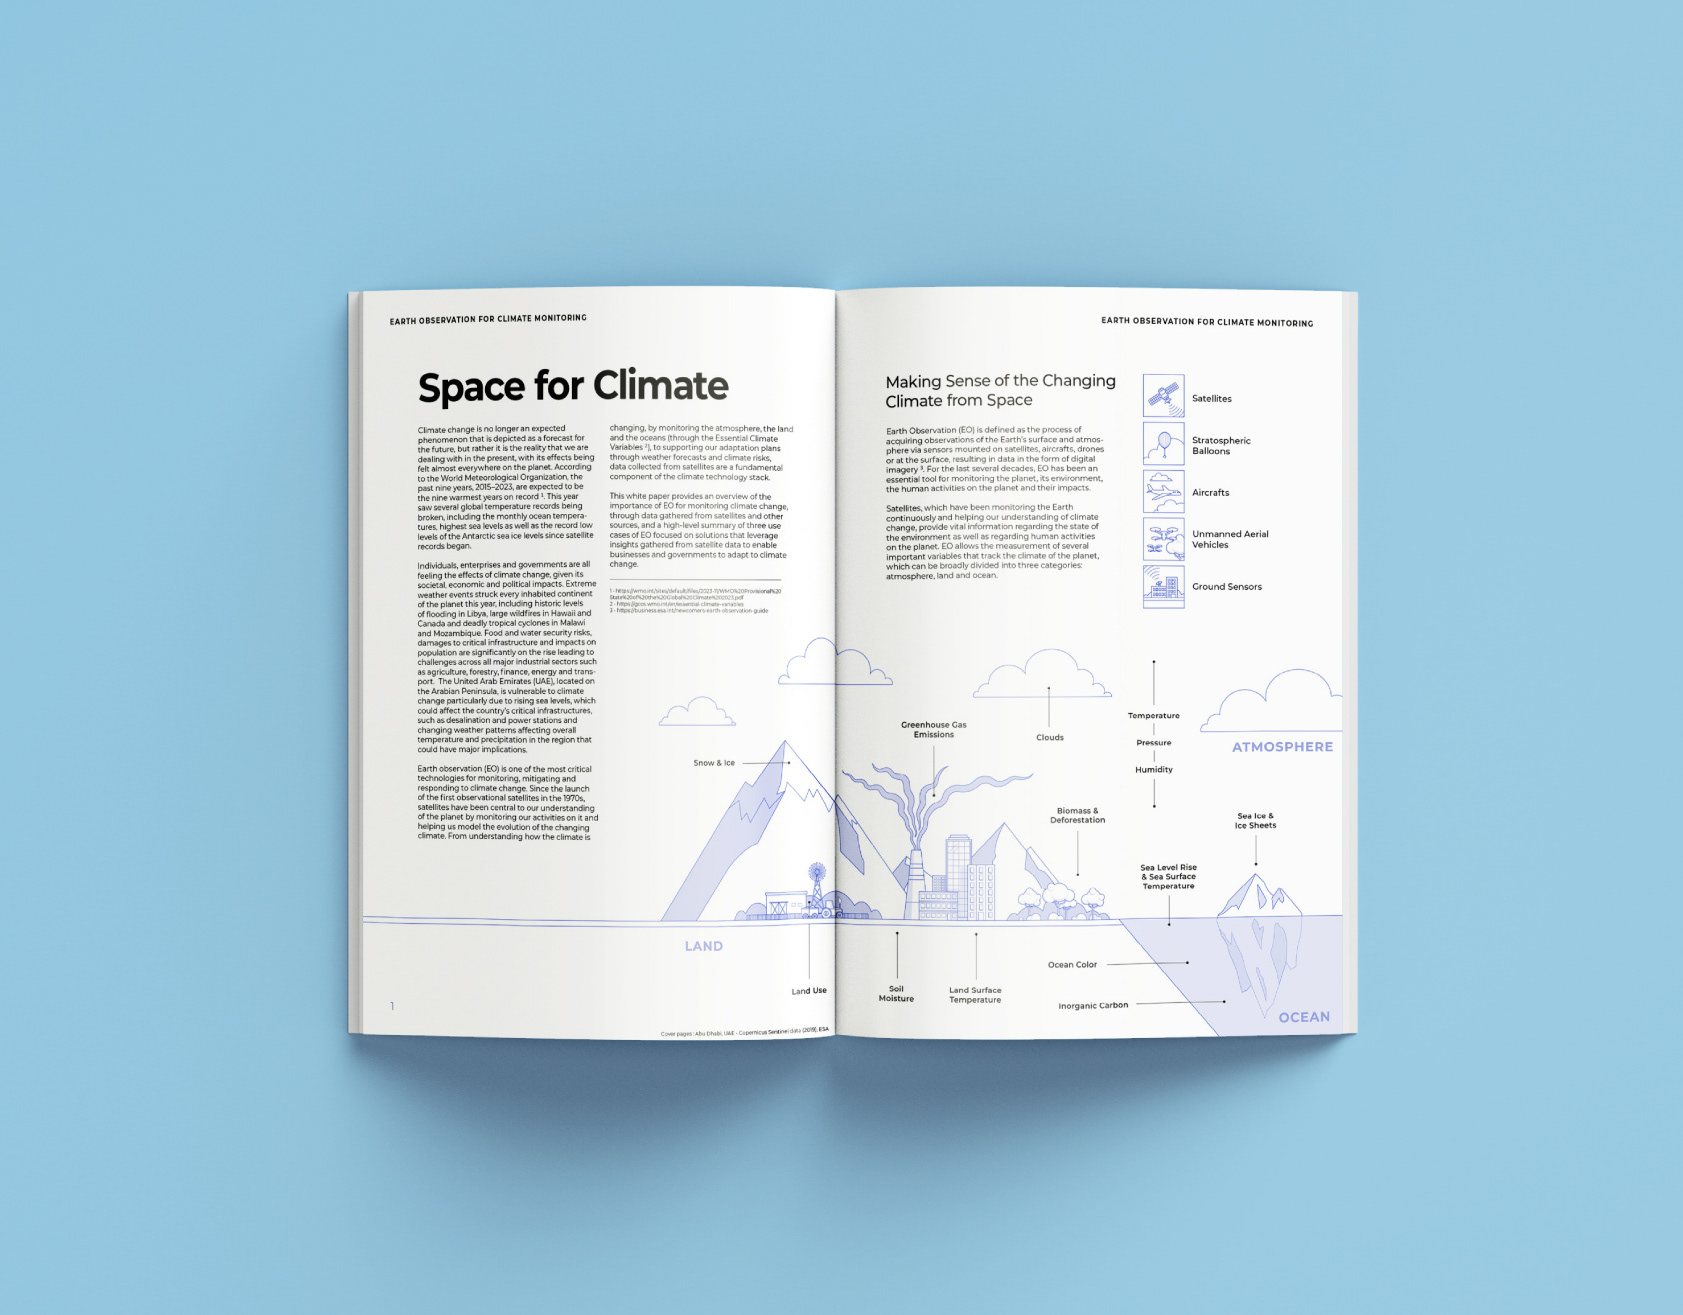
Land cover data details the physical land types on the planet (trees, grass, water etc.) and is usually represented using maps. In contrast with traditional geomapping, the land flower is a visual awareness tool that provides a snapshot of land cover distribution in a given country or area and allows easy visual comparison over time and across countries.
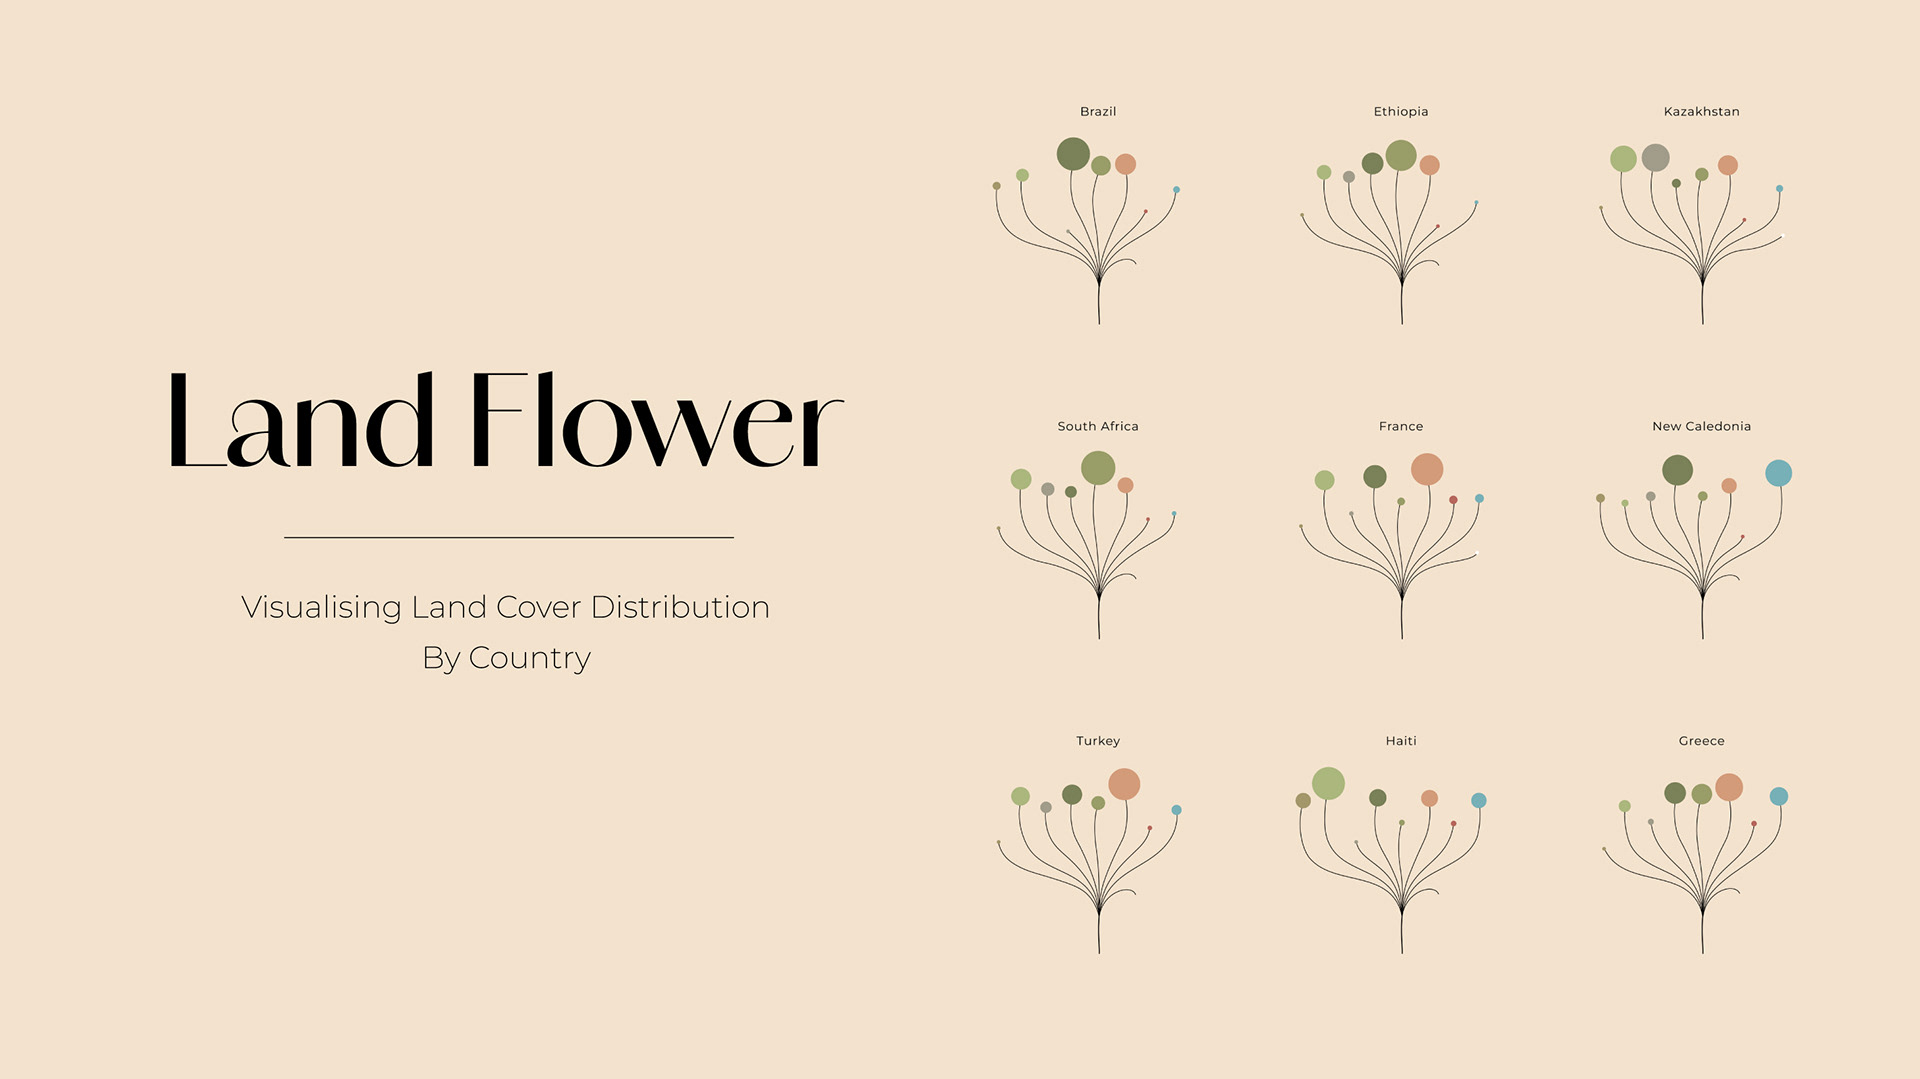
Land cover changes impact ecosystems, contribute to climate change and drive biodiversity loss. The wider public should be able to engage with this data easily. The colour scheme, explained below, was created to make it easy to grasp land cover issues. Natural areas are presented in shades of green while artificial areas, such as croplands and urban areas, are coloured in shades of red. With just a quick look at a land flower, anyone can perceive balance -or lack thereof- between natural and artificial areas, receding water bodies and snow linked to climate change or even issues with expansive croplands and deforestation.
This video takes the viewer along and introduces the basic concepts to enable them to read a land flower visualisation.
Presenting the wide, quasi-organic variety of land flowers aims to pique the curiosity of the viewer and engage them with the dataset.